This information is over 2 years old. Information was current at time of publication.

search.DataJournals: a Tool to Discover Data Published within Data Journals

Data journals are a means to share datasets and communicate detailed information about the methods and instrumentation used to acquire the data.

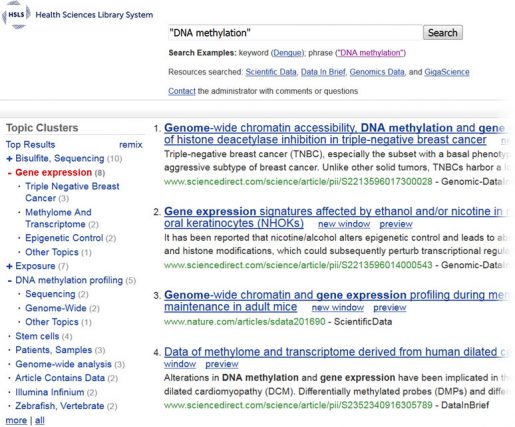
However, locating datasets shared via these publications can be challenging, as PubMed includes very few data journals and does not provide full-text searching to easily locate information not found in the title or abstract of an article. To facilitate this discovery, HSLS created a federated search portal named search.DataJournals, which searches the full text of four open access data journals: Data in Brief, Genomics Data, GigaScience, and Scientific Data.

A query will search across all fields of the data article including data description, materials, methods, instrumentation, data source location, and data accessibility. Search results are aggregated and ordered by relevance and can be filtered by clustered topical categories that are created on the fly based on the textual information of the retrieved records.

Contact HSLS Data Services if you have questions about using this tool, locating datasets, or sharing data.

~Melissa Ratajeski
This information is over 2 years old. Information was current at time of publication. This information is over 2 years old. Information was current at time of publication. This information is over 2 years old. Information was current at time of publication.

Final Rule for Reporting Trial Results to ClinicalTrials.gov Effective January 18

The Final Rule of the FDA Amendments Act of 2007 has updated registration and reporting requirements, effective January 18, 2017, with compliance mandated by April 18, 2017. The purpose of the final rule is to clarify the statutory language, expand the minimum reporting data set, and add critical details throughout the ClinicalTrials.gov record to improve effectiveness and compliance overall.

Important concepts such as “applicable clinical trial,” “secondary outcome measure,” and others have been more clearly defined to better standardize the service, making it easier to comply. The minimum reporting data set has been expanded to include information on race and ethnic background, time frame, adverse effects, statistical analysis plan (SAP), and other details, but the final rule emphasizes that these requirements are a baseline for reporting, and further results are welcome.

Reflecting the Final Rule, the National Institutes of Health (NIH) issued a separate rule, “Clinical Trials Registration and Results Information Submission,” summarizing that NIH-funded investigators must register and report trial results at ClinicalTrials.gov. The new rule emphasizes the role it plays in helping patients finding appropriate clinical trials in which to participate and improves “public trust in clinical research.”

A full analysis of the final rule is available in the New England Journal of Medicine Special Report, Trial Reporting in ClinicalTrials.gov—The Final Rule, in the November 17, 2016, issue.

For more information on data management, refer to the HSLS Data Management Guide, where you will also find contact information for the HSLS Data Management Group members.

~Andrea Ketchum

This information is over 2 years old. Information was current at time of publication.

Learn to Love Your Data

LYDW_2017_Heart_LogoThe week of February 13–17, 2017, is Love Your Data (LYD) week, a social media event designed to raise awareness about research data management, sharing, and preservation. This year’s theme is emphasizing data quality for researchers at any stage in their career. Each day of the week will focus on a different topic:

Monday Defining Data Quality: Define data quality, and the criteria for good (and bad) data.
Tuesday Documenting, Describing, Defining: Data documentation as a way to improve and manage data quality.
Wednesday Good Data Examples: Define and share examples of producing good and good enough data.
Thursday Finding the Right Data: Explain and share examples of finding and using good data.
Friday Rescuing Unloved Data: Describe techniques of caring for legacy data and existing data rescue initiatives.

Practical tips, resources, and stories will be shared via Twitter (#LYD17 or #loveyourdata) by librarians, data specialists, and researchers from all over the world. Join the conversation with your Pitt Librarians by following us at:

Health Sciences Library System (HSLS):

University Library System (ULS):

Special in-person and webinar classes will also be held by HSLS and ULS librarians throughout the week. Registration may be required. Classes offer by HSLS at Falk Library include:

  • “Data Visualization for Beginners” – February 13 at 10 a.m.
  • “You do WHAT with your Data?” – February 14 at 10 a.m.
  • “Future Proof your Data: Planning for Reuse” – February 15 at 3 p.m.
  • “Crafting a Data Management Plan (webinar)” – February 17 at noon

 ~ Melissa Ratajeski

This information is over 2 years old. Information was current at time of publication.

Mark Your Calendar: Love Your Data Week

lyd2017Join the librarians at the University of Pittsburgh in celebrating Love Your Data (LYD) week, a social media event designed to raise awareness about research data management, sharing, and preservation. During the week of February 13–17, 2017, practical tips, resources, and stories will be shared via Twitter (#LYD17 or #loveyourdata) and via in-person and online data classes offered at Pitt’s libraries. Mark your calendar and stay tuned for forthcoming details.
~Melissa Ratajeski

This information is over 2 years old. Information was current at time of publication.

Resources to Help You Learn and Use R

R is a programming language and software environment used for data analysis and/or visualizations. Below are several resources available to help you learn how to use R with your data.

Online training through lynda.pitt.edu (for Pitt users only)

The University provides access to online training via Lynda.com, which includes thousands of videos on topics such as Web design, video editing, Excel, PowerPoint, Photoshop, and more, including R.

To access this resource, visit the My Pitt portal page or the login link on the CSSD page. Use the Lynda.com search box to locate courses or browse the learning paths.  Continue reading

This information is over 2 years old. Information was current at time of publication.

The Potential of Clinical Trial Data Sharing: the SPRINT Data Analysis Challenge

The New England Journal of Medicine is hosting a challenge to explore the potential of clinical trial data sharing. Individuals and groups are invited to participate in the SPRINT Data Analysis Challenge by analyzing the dataset underlying the Systolic Blood Pressure Intervention Trial (SPRINT) Research Group’s article and identifying novel scientific or clinical findings that advance medical science.

A Randomized Trial of Intensive versus Standard Blood-Pressure Control,” SPRINT Research Group, New England Journal of Medicine, 373(22): 2103-16, November 26, 2015.

The SPRINT Challenge will have two rounds: a Qualifying Round and a Challenge Round. Participants must complete the Qualifying Round to become eligible to enter the Challenge Round. Details on how to enter, when the data will be released, and information regarding IRB approval and data use agreement requirements, are available at the “How To Enter” website.

Judges will be a group of experts and leaders in clinical research, data analysis and statistics, patient advocacy, and others. After the Challenge Round closes, all submissions will be open to the public for crowdvoting. For more information on the judging and awards, see the FAQs.

This information is over 2 years old. Information was current at time of publication.

Diving into the World of Data Visualization

You’ve collected your data—now what? Having a basic set of data visualization skills will enable you to effectively communicate their significance. From understanding how your audience will interpret a bubble chart on your conference presentation to having proficiency with data visualization software packages, there is a wide variation in levels of mastery.

Begin by learning some of the basic principles of visual design. You may already subconsciously practice some of these. Many of us use symmetry when creating visual objects because it can create a sense of balance or cohesiveness. Other rules challenge conventional wisdom. Did you know that pie charts are controversial in the design world? In his seminal work, The Visual Display of Quantitative Information, Edward Tufte argues that pie charts should never be used because it is very difficult for the viewer to compare quantities. Over thirty years later, we still see many data designers continuing to use pie charts. On what side of the debate do you fall?

Once you have the basic rules down, you can start scoping out some of the many data visualization tools that are available. Microsoft Excel can be used to create basic visualizations. Tableau is free software that can be used to analyze, synthesize, and then create interactive visualizations to present your data. If you’re motivated, R is a programming language and environment that can be used to create data visualizations. Try a few tools before committing so that you choose which is best for your data set and skills.

Whether you become an expert on beautiful and minimalist bar charts or learn how to create interactive three dimensional visualizations, data visualizations will help your audience explore your data for new insights and meaning.

HSLS offers two classes related to data visualization. If you’re interested in continuing the discussion, please attend our Data Visualization class on October 10 or Infographics class on October 7.

~Rose Turner

This information is over 2 years old. Information was current at time of publication.

Guiding Principles for Data Management: Is Your Data FAIR?

For the past several years, researchers, funders, publishers, software developers, institutions, and other research stakeholders have been discussing methods for data-sharing and data stewardship on a grand scale, recognizing the need for minimal principles and practices. The FAIR data principles were first formalized in 2014 at a workshop in Leiden, The Netherlands, and are available for comment at the website of Force11.

“FAIR” is an acronym representing data as (1) Findable (2) Accessible (3) Interoperable (4) Re-usable. The four FAIR principles add efficiency and value to research data when it is ready for journal submission with its associated manuscript.

  1. Findable
    • Data should have a unique and persistent identifier at all times;
    • The unique and persistent identifier locates the dataset in a digital space;
    • Data should be distinguished from all other data via metadata;
    • Identifiers for any concept used in a dataset should also be unique and persistent.
  2. Accessible
    • Access can be always obtained by machines and humans with appropriate authorization;
    • Access can be always obtained by machines and humans through an open, free, well-defined protocol;
    • Machines and humans alike can access metadata, even if the data object itself is not available.
  3. Interoperable
    • If metadata is machine-readable, the data object is interoperable;
    • If metadata formats use shared vocabularies, the data object is interoperable.
  4. Re-usable
    • Data objects should be compliant with the first three principles to be re-usable;
    • Metadata should include a clear data usage license permitting reuse;
    • Documentation of software, code, and similar files must be included for accurate reuse;
    • Data objects must be clearly associated with their source (provenance) for proper citation.

With the FAIR Principles, there are now methods to evaluate both data and data repositories:

  • The FAIR Principles provide a method for self-assessment of basic dataset interoperability and usability.
  • The Data Seal of Approval is granted by an international organization to data repositories that meet quality standards via self-assessment.

For data related questions, contact a member of the HSLS Data Management Group.

~Andrea M. Ketchum

This information is over 2 years old. Information was current at time of publication.

Electronic Lab Notebooks Now Available to Pitt Researchers

ELN What is an electronic lab notebook (ELN), and why use one? Quite simply, ELNs are designed to replace paper lab notebooks that can be damaged, misplaced, or potentially altered. The digital nature of ELNs allows for:

  • Location independence due to cloud storage
  • Saving text, images, links, references, comments, PDFs, and more
  • Searchable entries by keyword, date, or use
  • Secure backup and access
  • Sharing of notebooks among the researcher, primary investigator, and other lab members or collaborators
  • Traceable history of additions and deletions as all versions are saved indefinitely

labarchives-logoThanks to Computing Services and Systems Development (CSSD), Pitt now has an enterprise license for an ELN, LabArchives. After surveying the research community, it was determined that having access to an ELN facilitates researcher interest in improving workflow and data documentation, addresses the University’s legal, regulatory, quality assurance, records management, collaboration, and centralized reporting needs, and is valuable for research data management in general. CSSD has created numerous resources in support of LabArchives:

There are three ways for University of Pittsburgh researchers to access LabArchives:

  • Log in to my.pitt.edu. In the right column click on Electronic Lab Notebooks, which leads to the Web Authentication page. After entering your University Computing Account username and password, you will be directed to LabArchives.
  • Sign in directly from the LabArchives website, select University of Pittsburgh from the partner site login, and enter your information on the Web Authentication page.
  • Download the LabArchives app for iOS or Android to use on your mobile device.

LabArchives also has numerous resources to help users get started creating their lab notebooks:

The Health Sciences Library System Data Management Group is here to assist all University of Pittsburgh researchers with any data management questions, including those regarding ELNs. Additional information is available in the Data Management Guide.

~Carrie Iwema

This information is over 2 years old. Information was current at time of publication.

Pitt Data Management Survey

University researchers are invited to complete the University of Pittsburgh’s Data Management Survey. The purpose of this survey is to gain a better understanding of research data held at the University. The responses collected will inform the University’s Data Management Committee, which was created to examine the University’s needs regarding managing, storing, sharing, and archiving research data. The committee will explore how the University might best meet those needs and report its findings and recommendations to the Office of the Provost. You may visit http://pi.tt/datasurvey to complete the survey.

~Melissa Ratajeski

This information is over 2 years old. Information was current at time of publication.

Real-Time Open Data

Over the past few months, media coverage of the Zika virus has increased the visibility of data sharing as an important step within the research data lifecycle. To speed the research discovery, the global scientific community has committed “to sharing data and results relevant to the current Zika crisis and future public health emergencies as rapidly and openly as possible.”

However, such willingness to share data is far from the norm. Researcher Rachel Harding, a postdoctoral fellow at the Structural Genomics Consortium, University of Toronto, would like this to change and is making a bold statement by opening her research on Huntington’s disease to the world.

On her Web site, Lab Scribbles, she will be “uploading real-time experimental data in its rawest form. This will not be a polished data presentation which scientists normally present in journal publications or conference presentations but a real-life taster into the everyday workings and reality of being a postdoctoral scientist.” Her hopes are to accelerate the pace of discoveries, create collaborations, and make science accessible and interactive.

Her methods and data will be deposited in real-time to Zenodo, a repository operated by the CERN Data Centre. Visit the HSLS Data Repositories page to locate data repositories for your area of interest.

For more information on Harding’s willingness to share her data, see the press release from University of Toronto.

~ Melissa Ratajeski

This information is over 2 years old. Information was current at time of publication.

Sharing Clinical Trial Data: Your Comments Needed

The International Committee of Medical Journal Editors (ICMJE) is seeking feedback on its proposed requirements for sharing clinical trial data: “…the ICMJE proposes to require authors to share with others the deidentified individual-patient data underlying the results presented in the article (including tables, figures, and appendices or supplementary material) no later than 6 months after publication.” Read the full proposal: Sharing Clinical Trial Data: A Proposal from the International Committee of Medical Journal Editors and submit your comments by April 18, 2016, to have your voice heard.

Note: many journals follow the Recommendations for the Conduct, Reporting, Editing and Publication of Scholarly Work in Medical Journals (ICMJE Recommendations), including New England Journal of Medicine, Circulation, and Pain.

~Melissa Ratajeski