
The ability to view the number of cases, hospitalizations, and deaths from COVID-19 has decidedly improved since the first U.S. cases were diagnosed. Non-governmental organizations initially tasked themselves with providing COVID data access using county, state, and U.S. maps (Coronavirus Tracking Center from Johns Hopkins). The COVID Racial Data Tracker was developed a little later to highlight the increased risk of COVID incidence and mortality for people of color.
In January 2021, the U.S. Centers for Disease Control and Prevention (CDC) released the new public-facing COVID Data Tracker, providing access to the most current information, incorporating daily updates, and showing county, state, and national levels using maps with data download options.
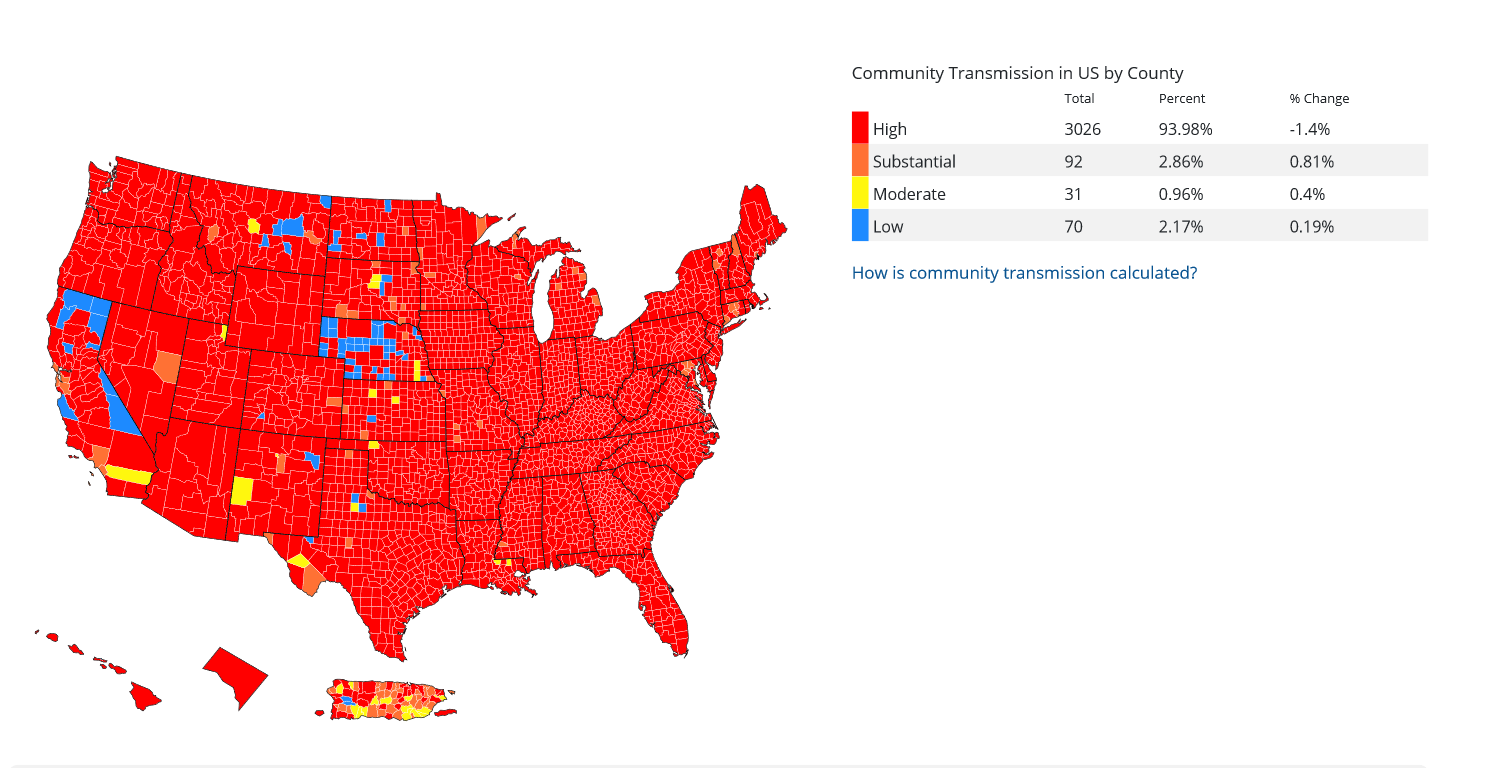
The county level map data includes the level of community transmission, cases, deaths, mortality, and more. You can also view a 20-day time-lapse map of community-level transmission by county. The maps can be a little misleading: Nebraska stopped sending COVID data in July; other states reduced the number of weekly reports sent; and several fail to include information such as where patients live, whether they were hospitalized or survived, or even what their race and/or ethnicity is. Consequently, the data may appear in state estimates on the COVID Data Tracker but are not available for other estimates.
This site also includes a collection of data resources related to health equity; case and death trends by age, race/ethnicity, and sex; and recent data for cases and deaths by county level population factors (including Multisystem Inflammatory Syndrome in Children (MIS-C)).
The Pandemic Vulnerability Index is best accessed directly from the National Institute of Environment Health Sciences (NIEHS), although it is also embedded in the COVID Data Tracker site. It is much easier to manipulate the map from the NIEHS site. Review the user guide to fully understand the options.
You may want to download your own data for additional analysis. Fortunately, there are several publicly available sources of raw COVID-19 data. The New York Times provides access through GitHub. The CDC has a number of COVID-19 datasets that you can download. You can view all of them or you can view the datasets by category: Case Surveillance, Vaccinations, and Policy Surveillance.
~Helena M. VonVille