A genome-wide association study (GWAS) explores the human genome to uncover genetic variants associated with a range of outcomes, including diseases, laboratory measurements, and social factors. When the first GWAS was published in 2005, the process was both time-consuming and costly. Since then, technological advancements have significantly streamlined these studies, making them faster and more accessible to researchers. Despite the proliferation of GWAS, the majority have focused on European populations, leaving potential genetic links to diseases in other ancestral groups largely unexplored. This lack of diversity highlights a critical gap in genetic research. With the rise of personalized medicine initiatives, there is a pressing need to expand GWAS to include these historically underrepresented groups, ensuring that the benefits of genomic medicine are accessible to all populations.
In response, the National Institutes of Health (NIH) launched the All of Us Research Program (AoURP) in 2015, promoting inclusive precision medicine. This program has amassed a comprehensive collection of data, including genome sequences, physical measurements, electronic health records, surveys, and FitBit data, with a strong focus on diversifying the genetic profiles traditionally studied in the U.S. This extensive biobank provides an optimal setting for conducting GWAS. To further support these efforts, HSLS has created templates specifically designed to aid the Pitt community in initiating their own GWAS. Available through Google Drive and GitHub, these resources enable researchers to effortlessly undertake GWAS on any number of outcomes of interest.
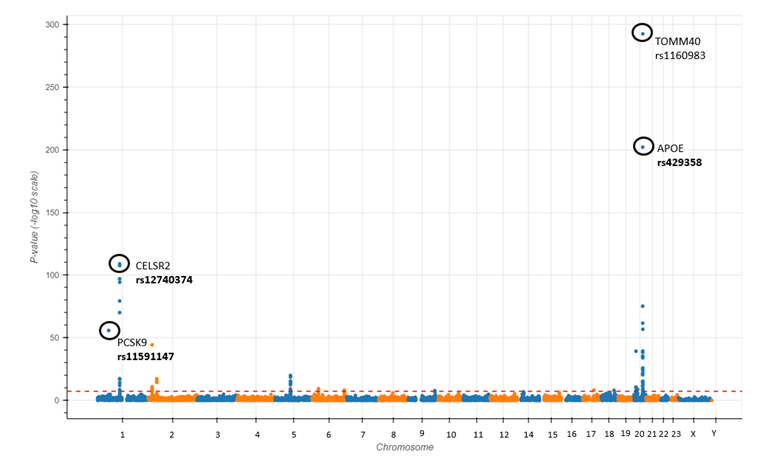
To validate the All of Us data and the GWAS template, we analyzed LDL cholesterol levels (measured in mg/dL) for 84,648 participants with lab measurements and genomic sequences available. The study adjusted for age, sex, statin use, BMI, smoking, and the first three principal components of ancestry. Linear regression was employed to assess the significance of genetic associations, with the p-value threshold established at 5e-08. The Manhattan plot [Figure 1], available for interactive viewing after downloading, distinctly highlights spikes linked to gene variants in PCSK9 and CELSR2—genes known to influence LDL levels. This promising outcome not only demonstrates the efficiency of this template but also highlights its potential to empower Pitt researchers to address complex genomic research questions using the All of Us database.
~Alexis Cenname